Featured Projects
Explore my portfolio of data analytics projects that have delivered measurable business impact through insightful visualizations and strategic recommendations.
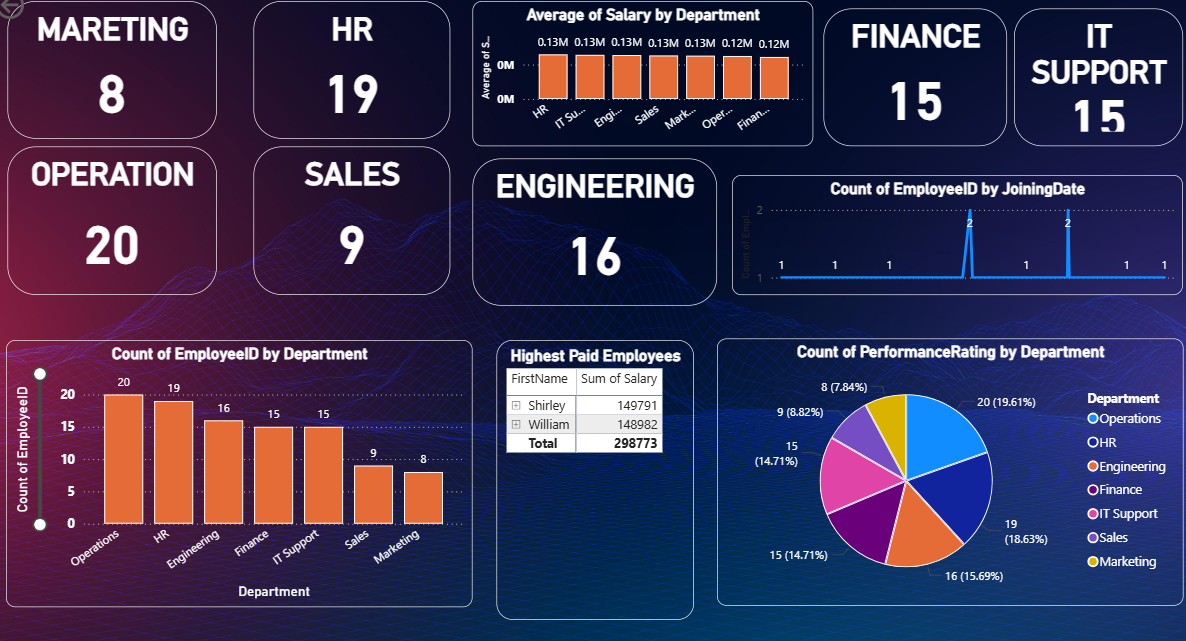
Comprehensive HR Analytics Dashboard
Developed an enterprise-level HR analytics dashboard that provides comprehensive insights into workforce dynamics across multiple departments. This interactive dashboard tracks 102 employees across 7 departments, analyzing key metrics including salary distributions, performance ratings, and employee joining patterns.
Key Features & Insights:
- Real-time tracking of 102+ employees across Operations, HR, Engineering, Finance, IT Support, Sales, and Marketing
- Salary analysis revealing average compensation of $0.13M across departments
- Performance rating distribution with detailed departmental breakdowns
- Employee joining trends with peak hiring periods identification
- Top performer identification with salary benchmarking
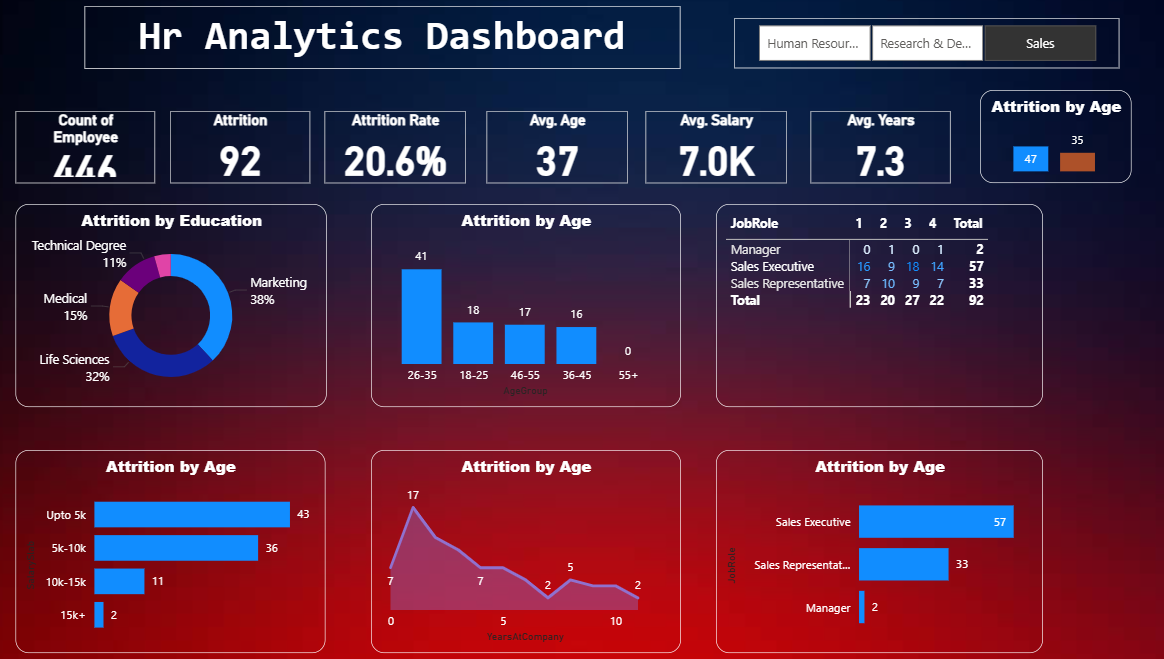
Employee Attrition Analysis Dashboard
Created a specialized attrition analysis dashboard that identifies key factors contributing to employee turnover. This strategic tool analyzes 446 employees with a 20.6% attrition rate, providing actionable insights for HR retention strategies and workforce planning.
Strategic Insights Delivered:
- Attrition rate analysis: 20.6% overall with 92 departures from 446 employees
- Age demographics: Average age of 37 years with targeted retention strategies
- Education impact: Marketing (38%) and Life Sciences (32%) showing highest attrition
- Salary correlation: Average $7.0K salary with 7.3 years average tenure
- Job role analysis: Sales Representatives (33) and Sales Executives (57) most affected
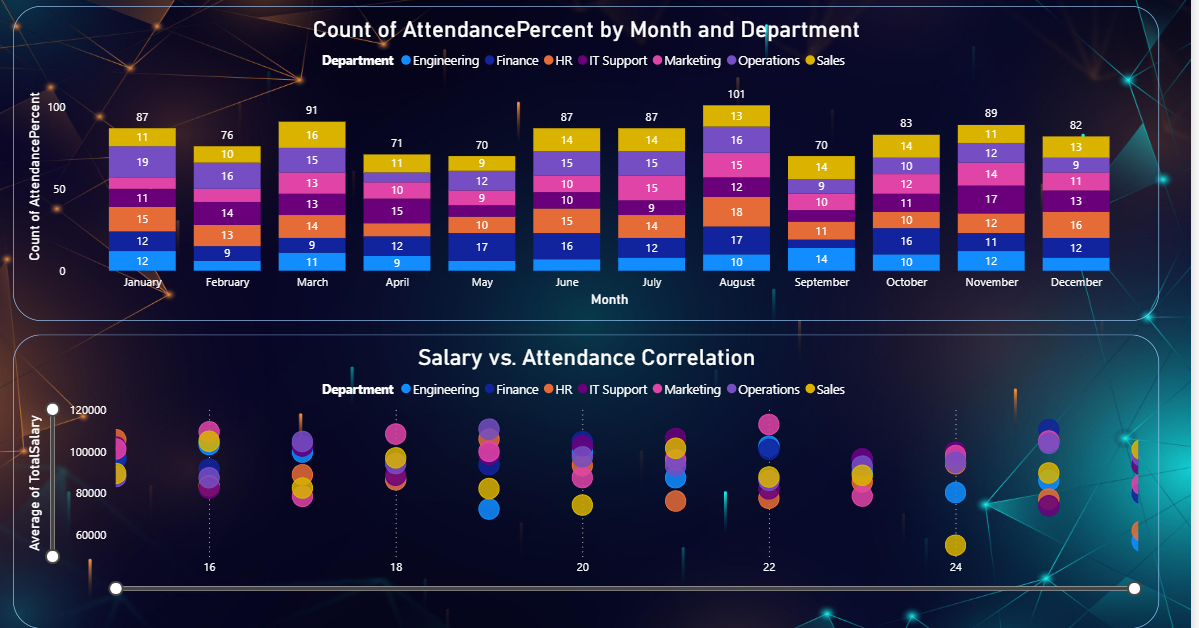
Attendance & Performance Correlation Dashboard
Engineered an advanced correlation analysis dashboard that reveals the relationship between employee attendance patterns and salary performance across departments. This innovative visualization combines temporal analysis with compensation data to identify productivity patterns and optimize workforce management.
Advanced Analytics Features:
- Monthly attendance tracking across 7 departments with seasonal trend analysis
- Peak attendance periods: August (101%) and December (89%) performance metrics
- Salary vs. attendance correlation scatter plot revealing performance patterns
- Department-wise attendance distribution with color-coded visualization
- Compensation range analysis: $50K-$120K with attendance correlation insights
Ready to transform your data into actionable insights?
Start Your Project Today